OFF THE WIRE
Great name for a 60's band.... Drop Experience
I think the useful part, for those who go to court, is the experiment reports statistically significant test results from lab to lab. That is info that could be used in court, provided the report is not thrown out as hearsay since the experts who wrote the report are not there to testify.
Is it a worthwhile document to present as evidence? I think it depends on what else you have for evidence and what your strategy is. Some of the prefacing info could be useful to substantiate that FMVSS is not applicable after point of sale, but that the primary proof of that is Title 49 Chapter 301, 30102. Applicabiity and Non-Applicability.
Here's the experiment I'd like to see the results of: There are theories we hear over and over, "the visual test" results vary significantly from one LEO to another, or one county to another, and even from one day to another. Catch a cop having a bad day, and you might have rode past him/her with the same helmet every day for the last five years with no incident, then one day, a ticket quota needs to be filled and "badabing badabang!", you 're ticketed and you don't like it.
Warren Woodward wrote:
Thought you'd need the most up to date info for your helmet manufacturing. You'll be relieved to know that what you've maintained all along is now official -- test conditions, helmet locations, and drop experience are not statistically significant factors.
"Drop experience" - gotta love the lingo.
Analysis of Helmet Impact Velocity Experimental Data and Statistical
Tolerance Design
DOT HS 811 305
April 2010
PDF 19 pages:
http://www-nrd.nhtsa.dot.gov/Pubs/811305.PDF
Abstract Helmet impact velocity experimental data is analyzed and
various factors that influence the impact velocity are studied. One of
the main goals of this report is to verify whether a tolerance of +/- 3
percent of mean velocity is feasible and will allow at least 95 percent
of impacts to fall within the proposed impact velocity range.
Statistical methods are applied to the design of impact velocity
tolerances. Calibration procedures and data variances from several
laboratories are also incorporated into this analysis.
5. CONCLUSIONS
. Experimental data of drop tests indicate that two factors are
statistically significant in influencing impact velocities, the
laboratory at which the test was conducted, and the drop height for each
anvil. Conversely, test conditions, helmet locations, and drop
experience are not statistically significant factors in influencing
impact velocities.
. The experimental design data variances are from both test procedures
used by test technicians and laboratory instruments, and the combined
variances are used to design the velocity tolerance ranges.
. All test laboratories have satisfactory calibration standards
comparable with the NIST standard. Lab A has a slightly smaller impact
velocity deviation compared with Lab B, and both are satisfactory.
. It is determined that on average more than 99 percent of impacts will
fall within the impact velocity range, if the +/-3 percent nominal
tolerance range is adopted, and the velocity interval of 97 percent
nominal to 103 percent nominal is acceptable.
skip to main |
skip to sidebar


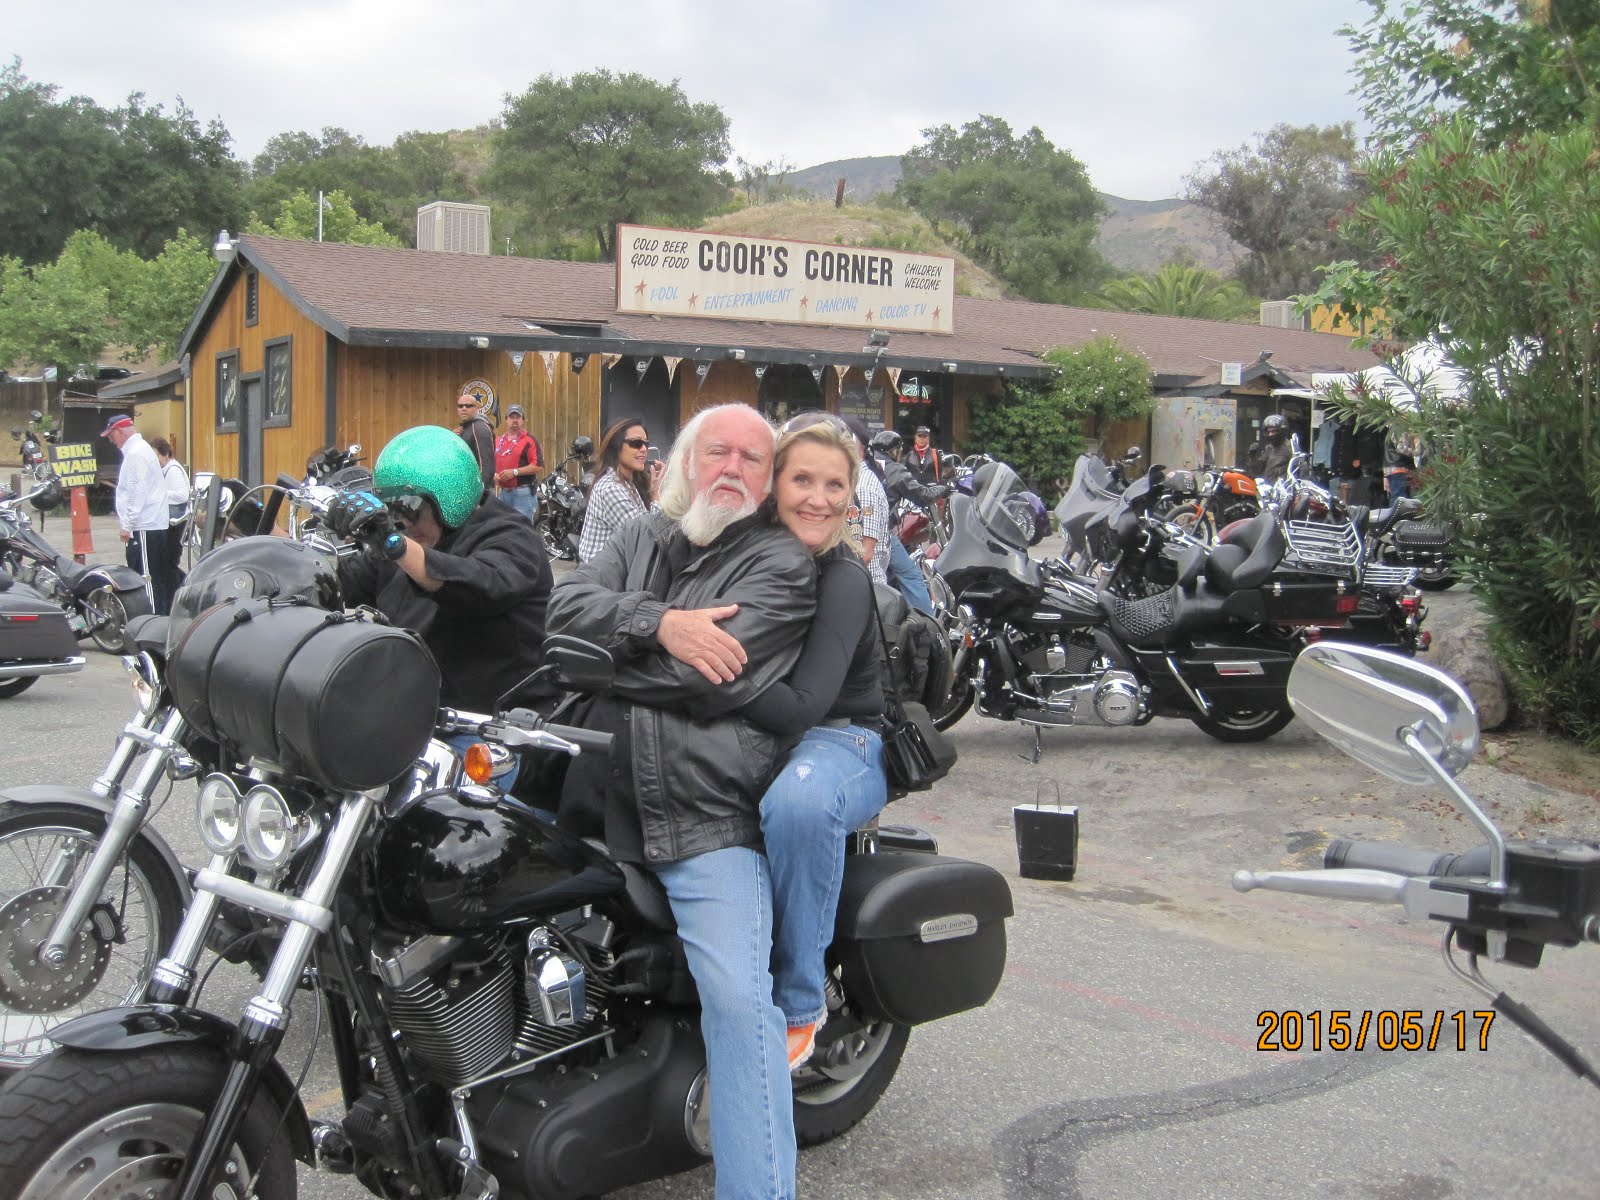
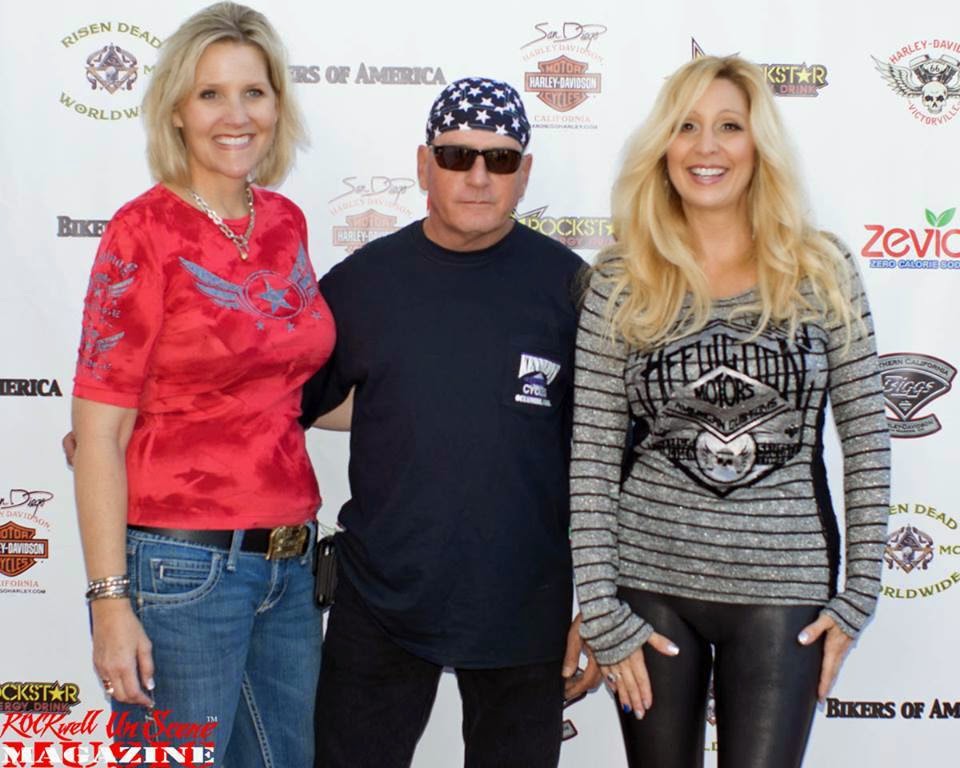
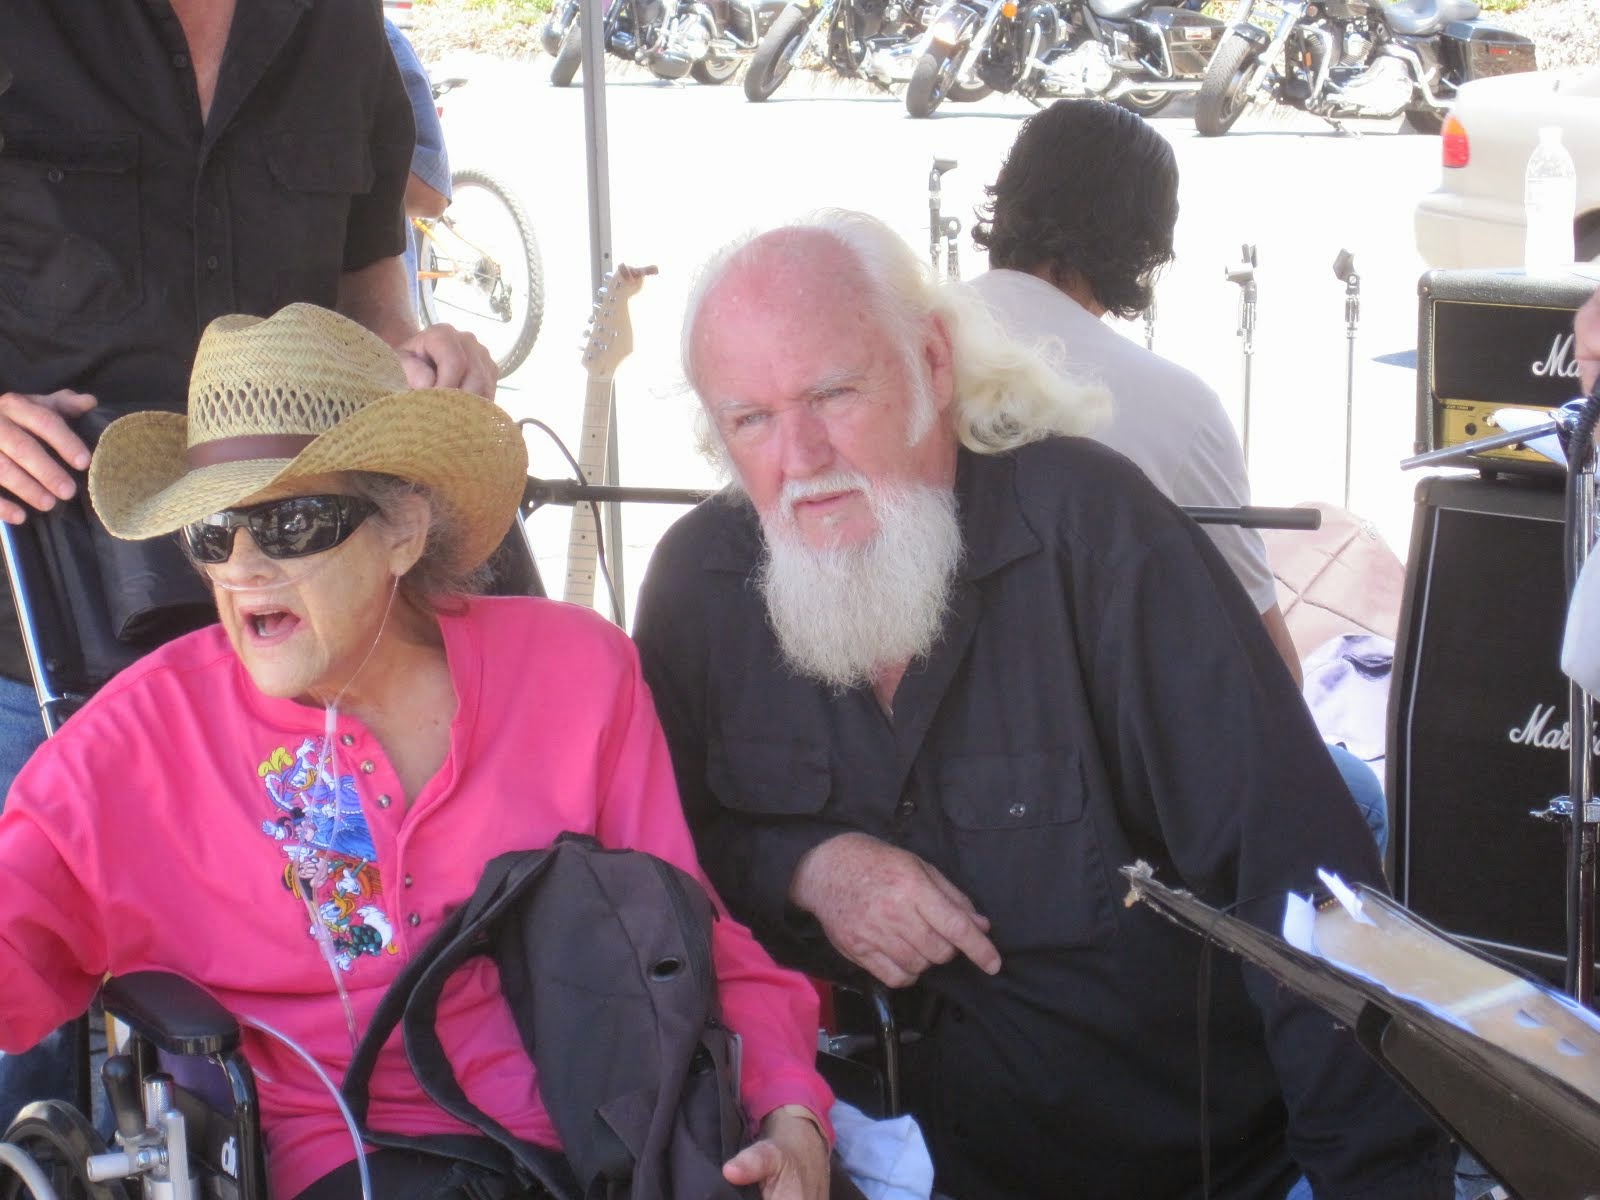
Bill & Annie
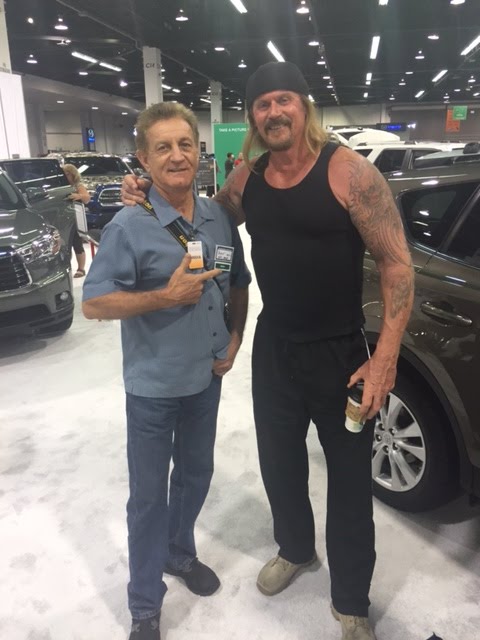
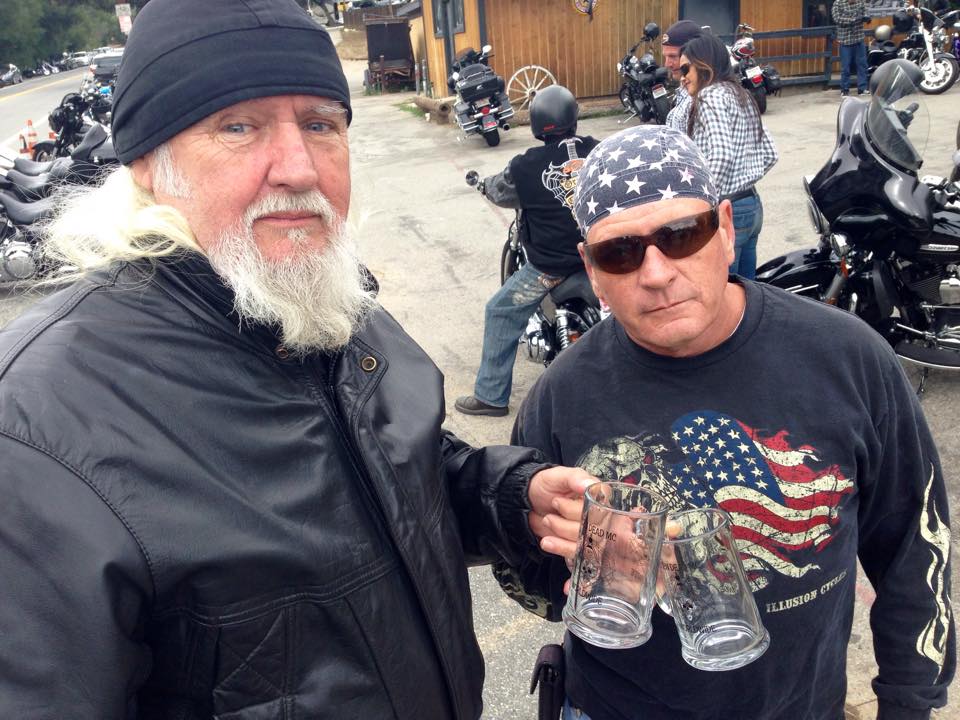
Art Hall & Rusty


NUFF SAID.......


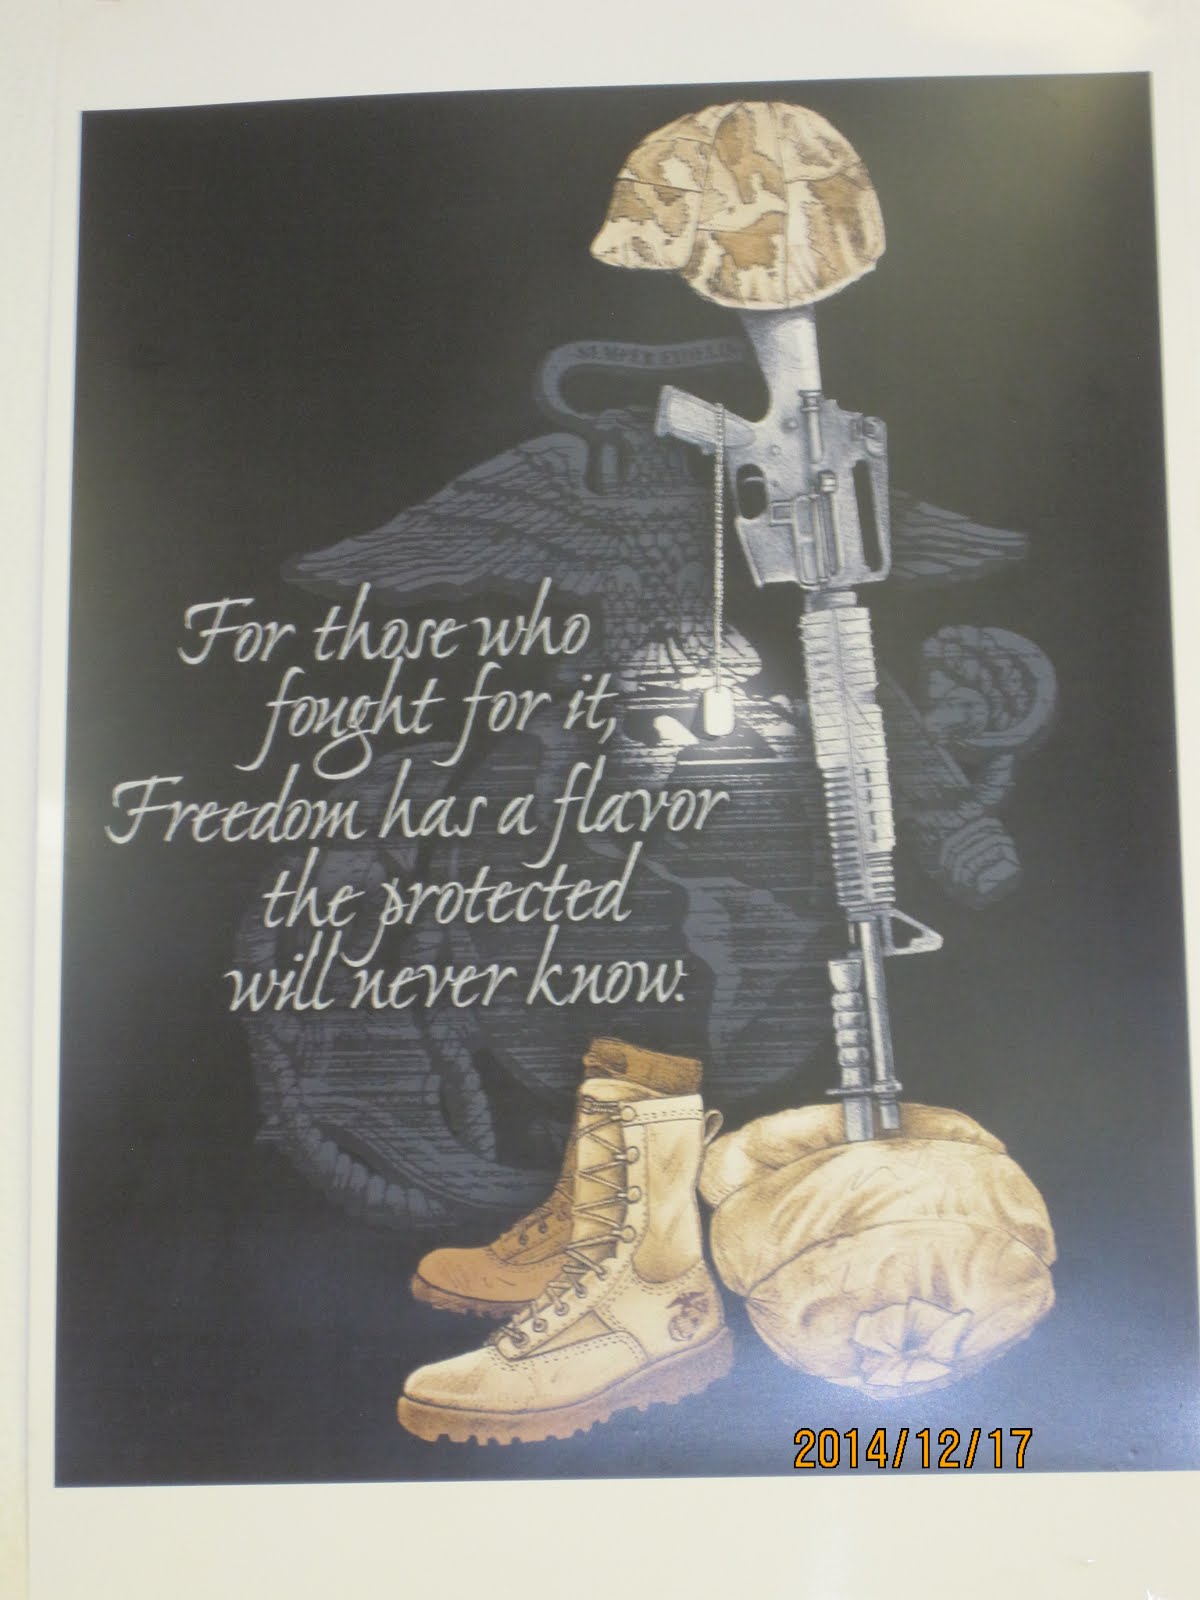


OOHRAH

ONCE A MARINE,ALWAYS A MARINE
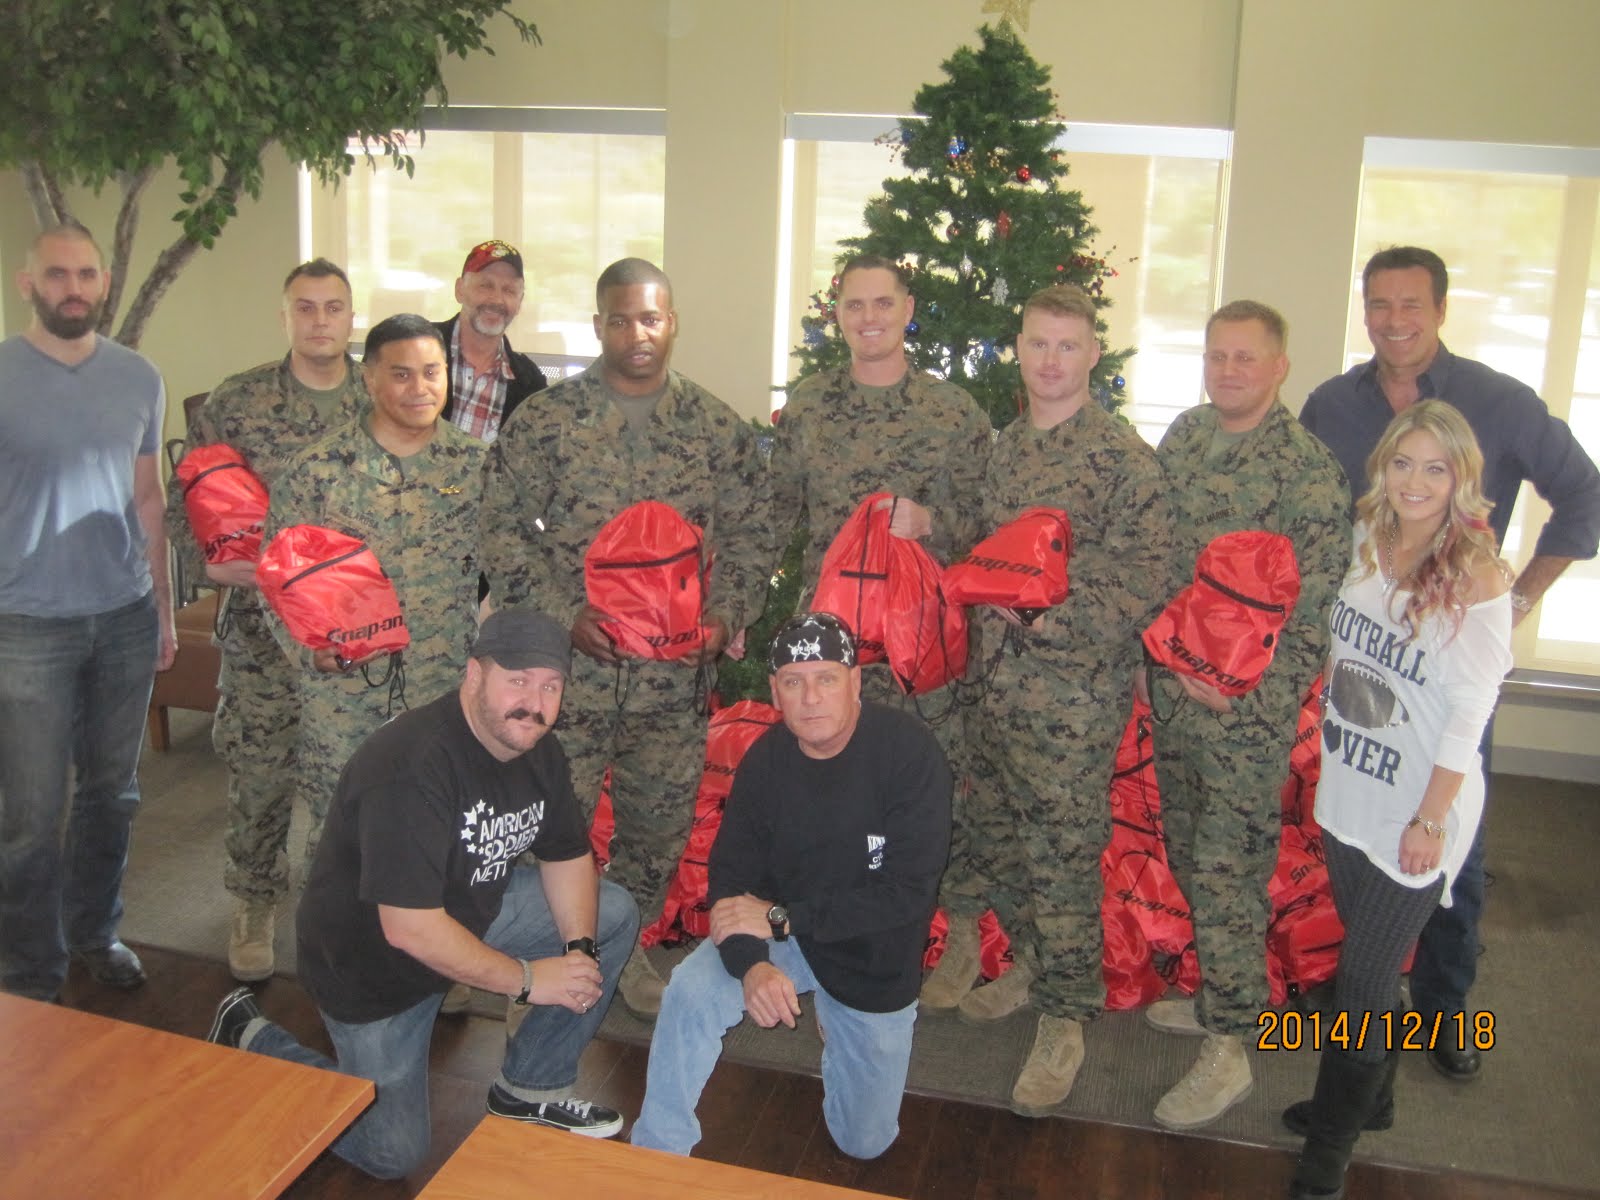
GIVING BACK
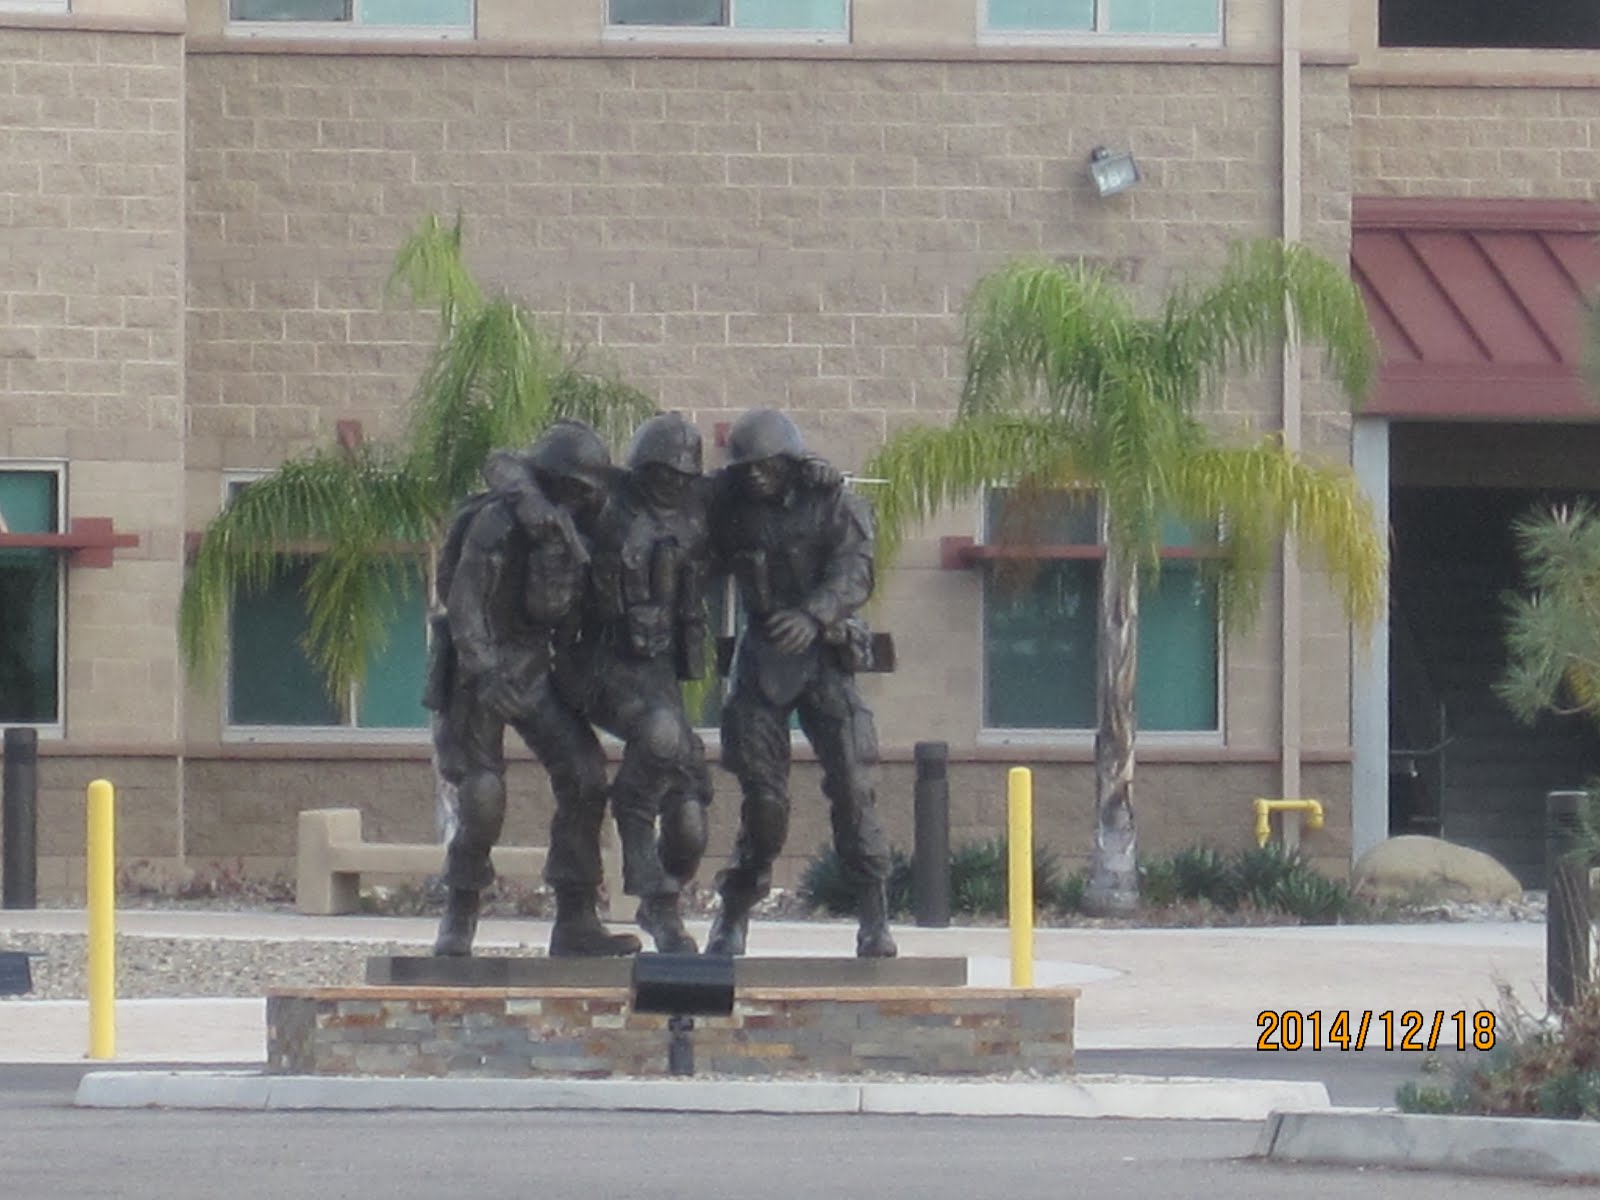
MOUNT SOLEDAD

BIKINI BIKE WASH AT SWEETWATER


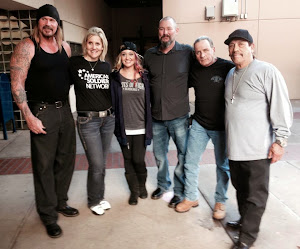
FRIENDS


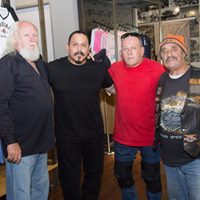
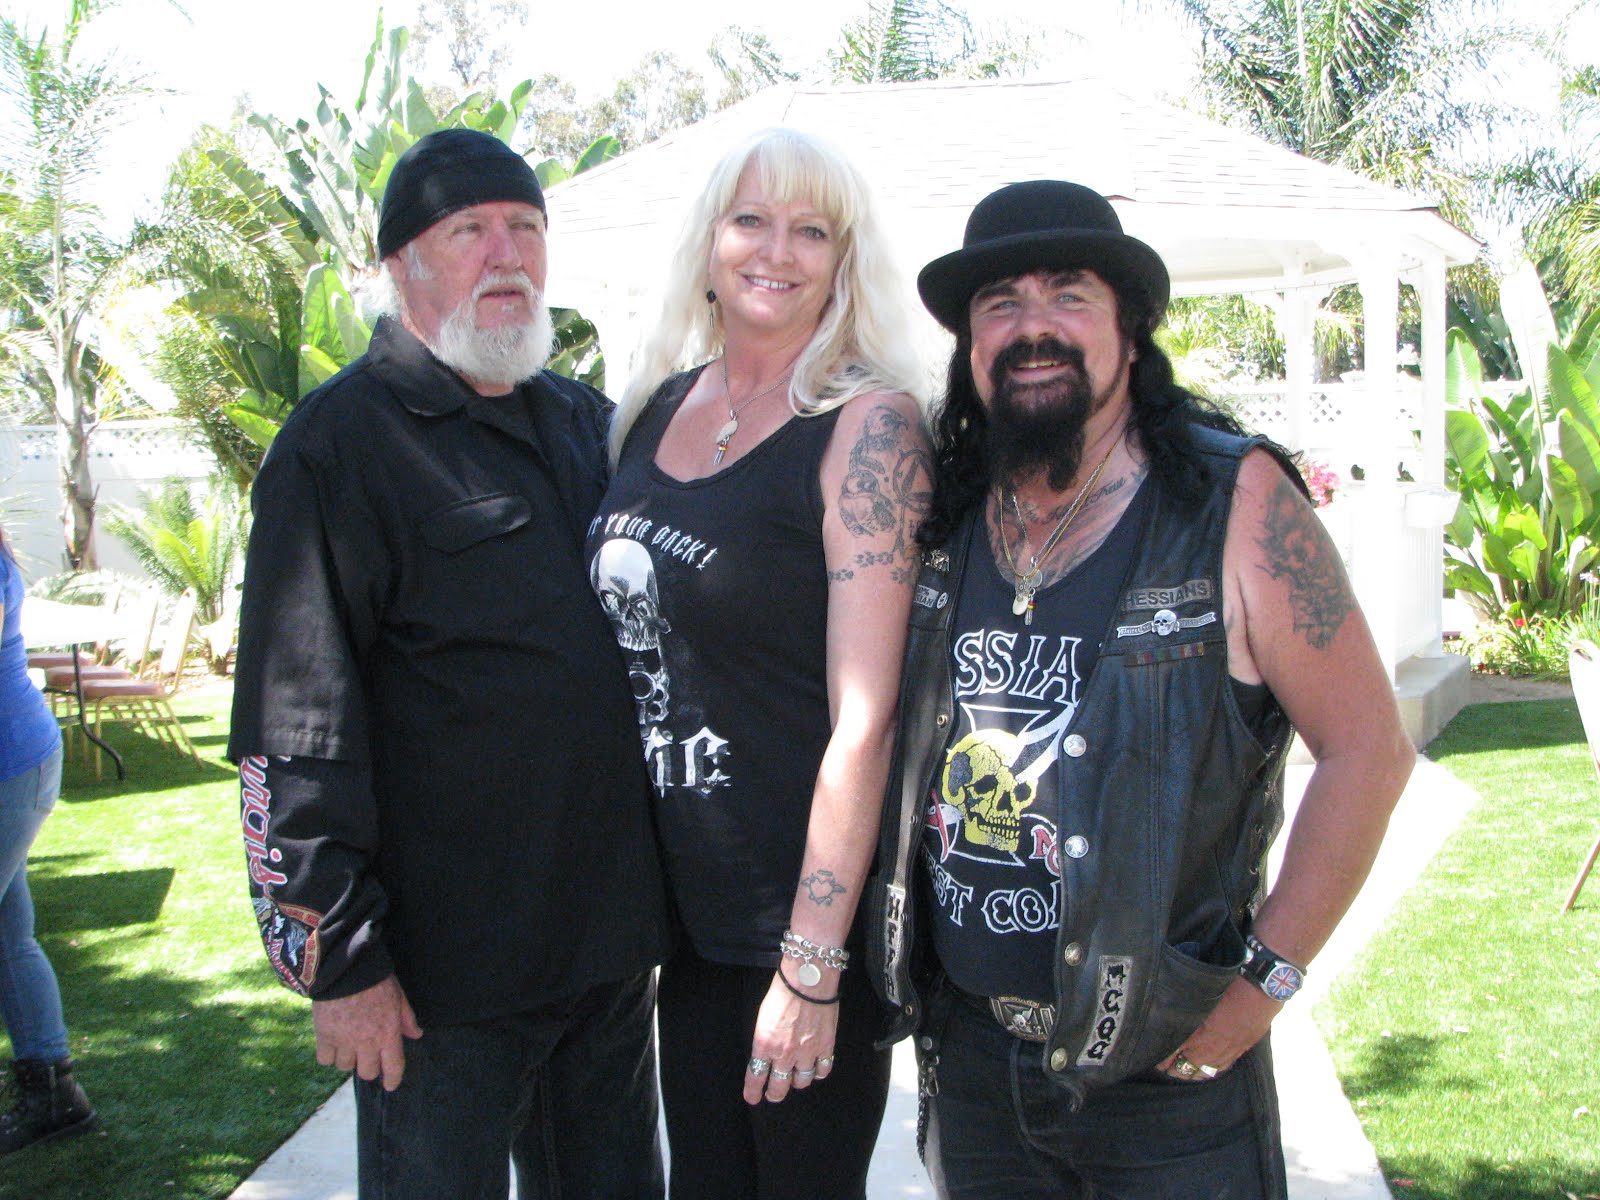
BILL,WILLIE G, PHILIP


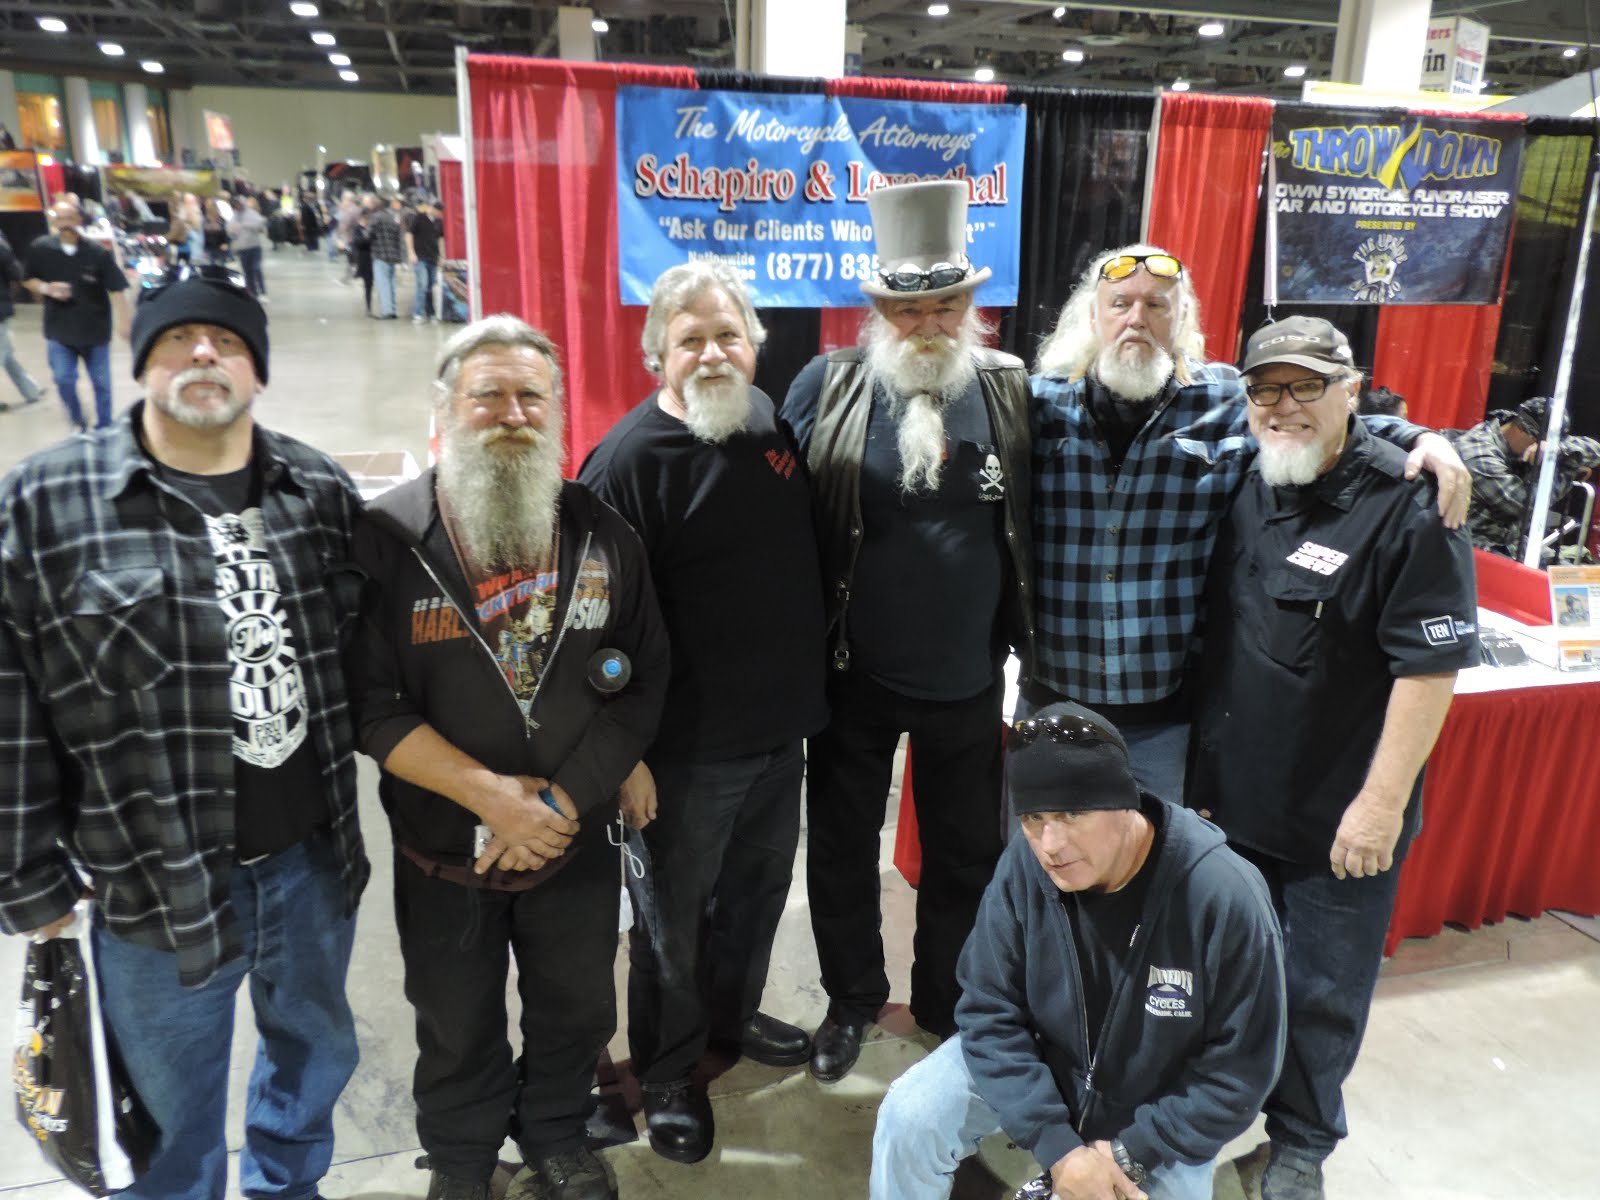
GOOD FRIENDS
hanging out
brothers
GOOD FRIENDS
Good Friends
Hanging Out


Bill & Annie
Art Hall & Rusty

Art Hall & Rusty


NUFF SAID.......


NUFF SAID......


Mount Soledad


BALBOA NAVAL HOSPITAL

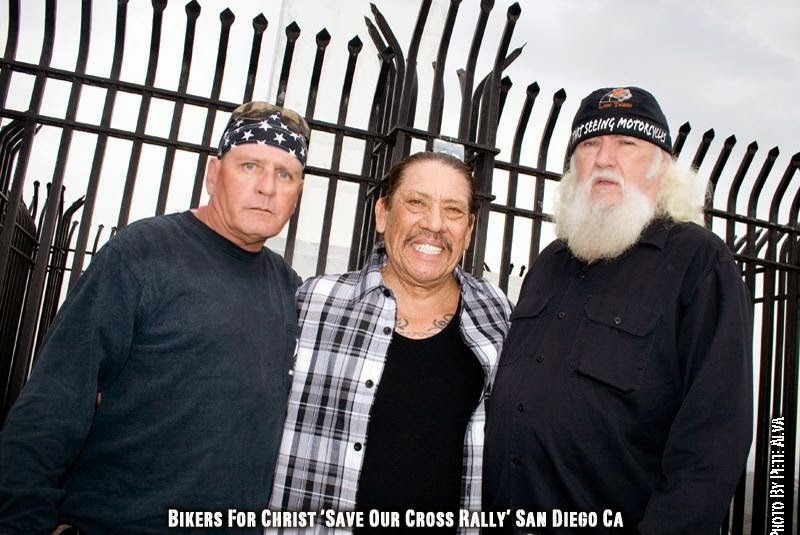
RUSTY DANNY

ANNIE KO PHILIP

PHILIP & ANNIE

OUT & ABOUT

OOHRAH...

OOHRAH
ONCE A MARINE,ALWAYS A MARINE

ONCE A MARINE,ALWAYS A MARINE
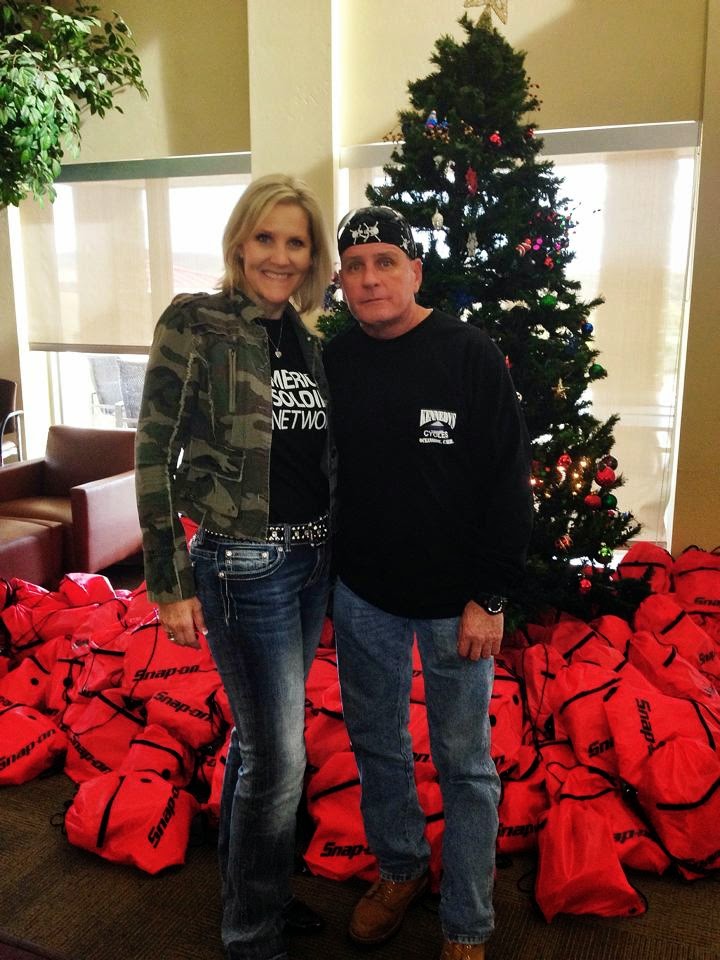
American Soldier Network GIVING BACK

GIVING BACK
CATHY & BILL

PHILIP & DANNY & BILL

MOUNT SOLEDAD
bills today

EMILIO & PHILIP

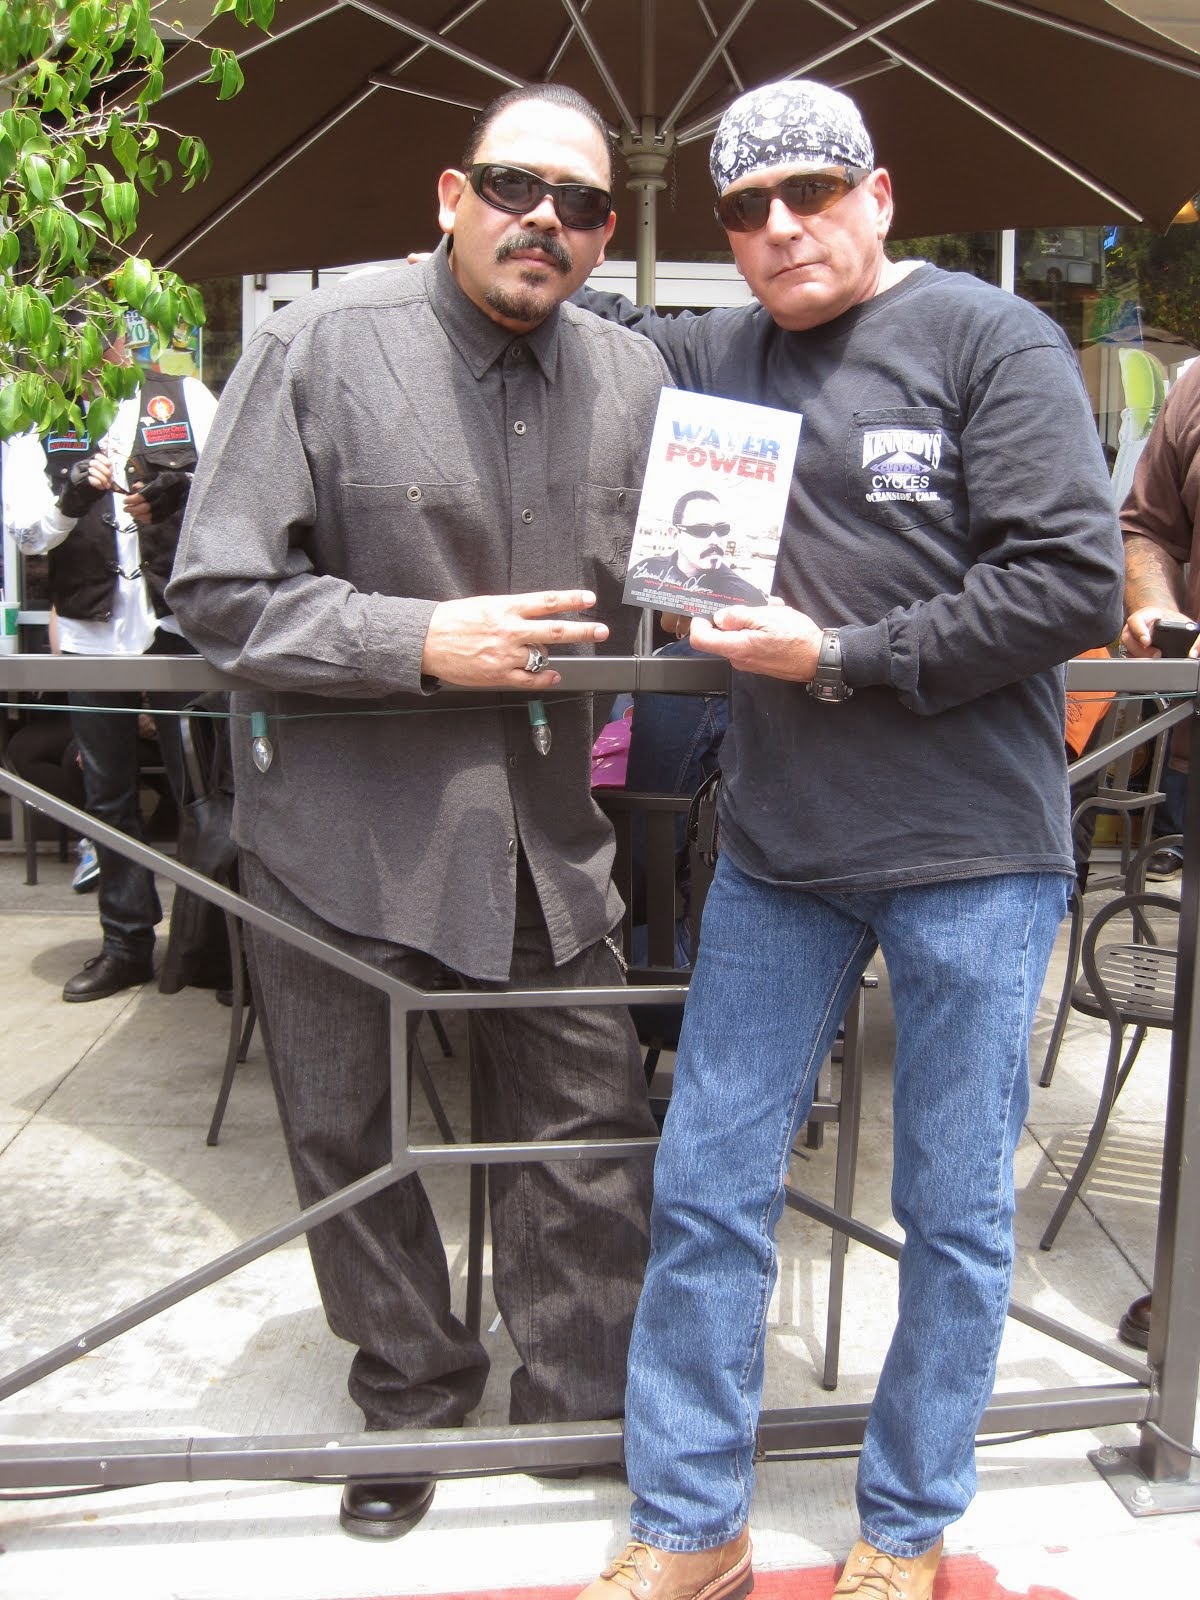
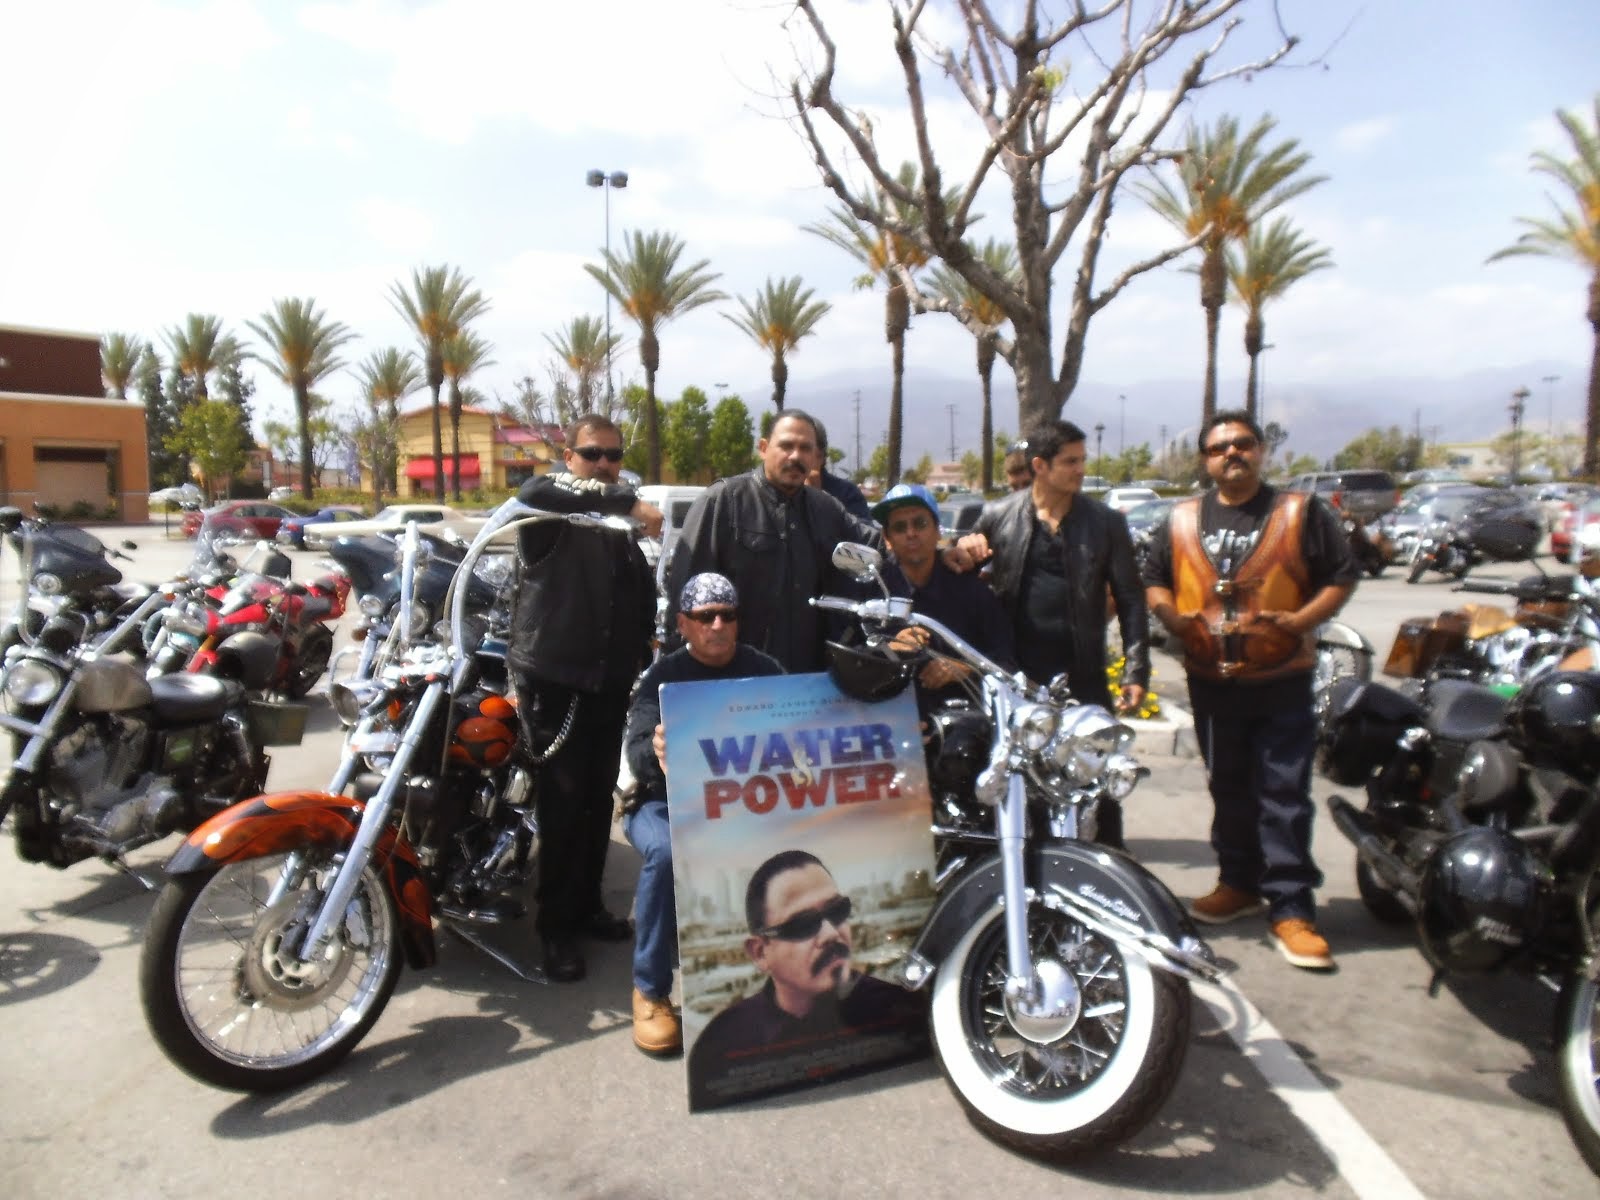
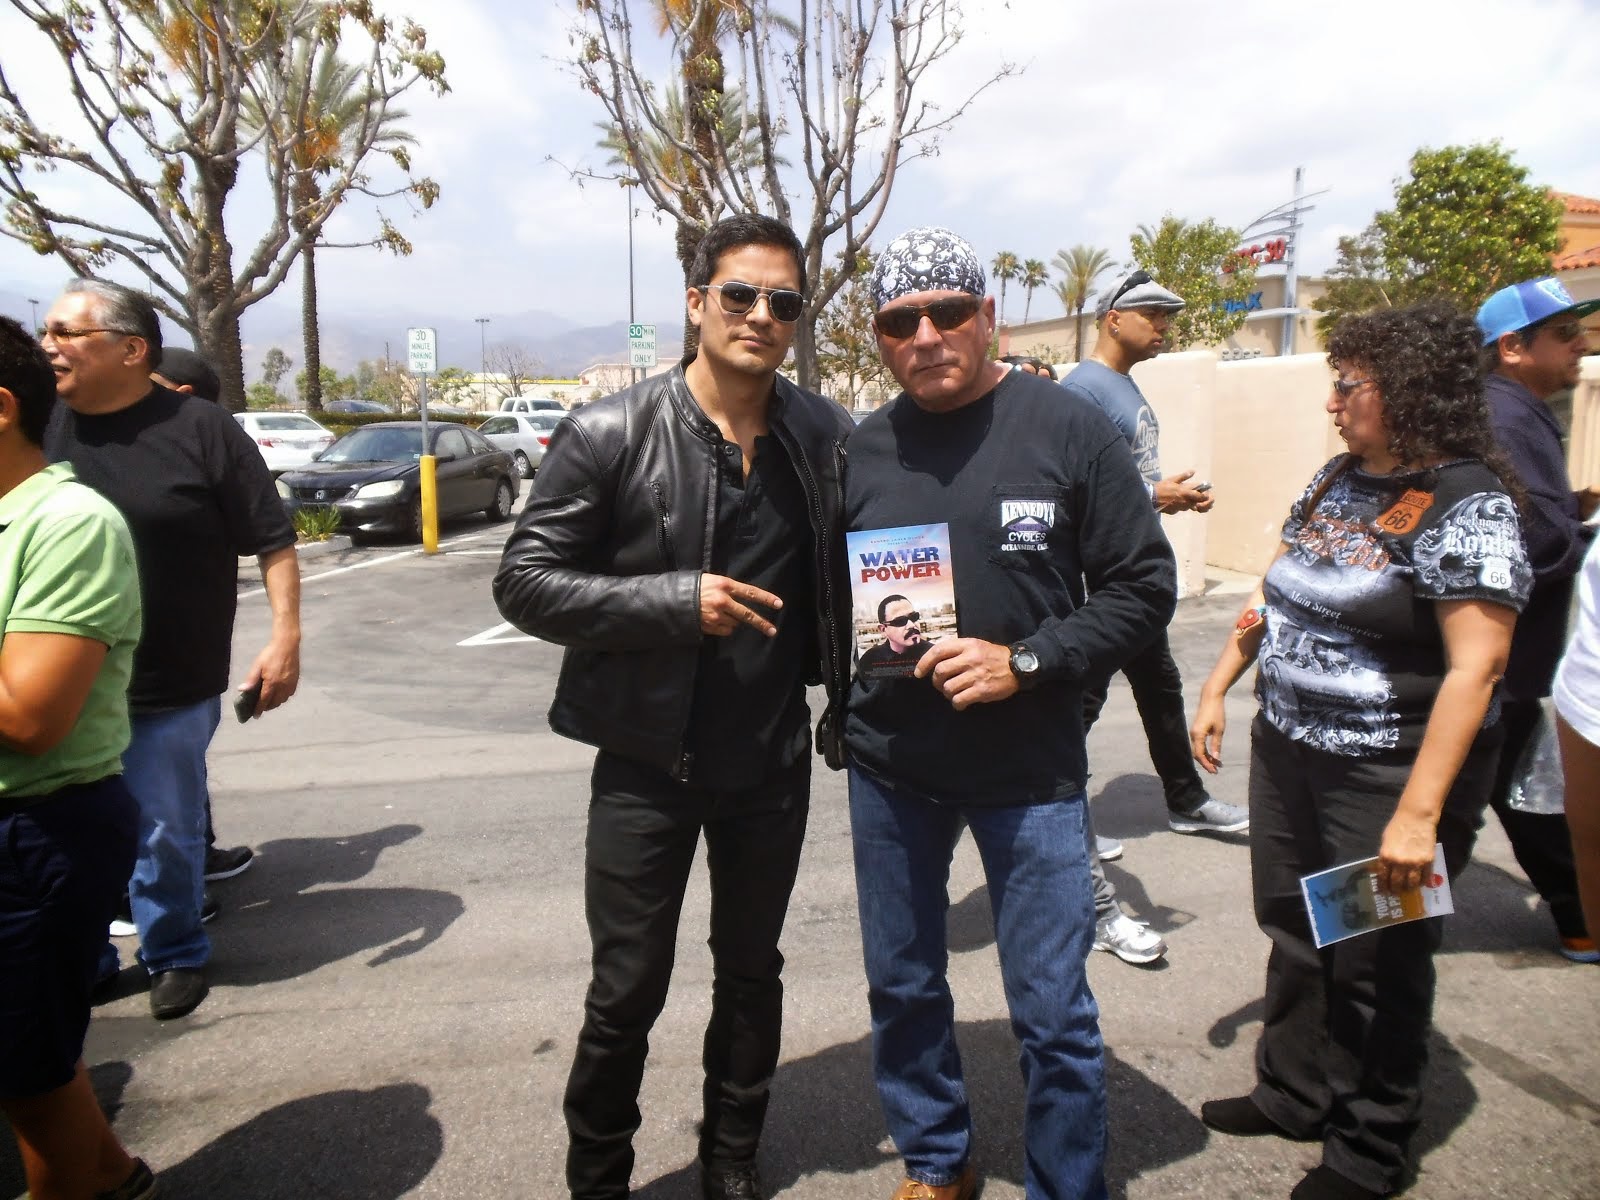
WATER & POWER

WATER & POWER


bootride2013


BIKINI BIKE WASH AT SWEETWATER


ILLUSION OPEN HOUSE

FRIENDS


GOOD FRIENDS


BILL,WILLIE G, PHILIP


GOOD FRIENDS

GOOD FRIENDS
Friends
- http://www.ehlinelaw.com/losangeles-motorcycleaccidentattorneys/
- Scotty westcoast-tbars.com
- Ashby C. Sorensen
- americansoldiernetwork.org
- blogtalkradio.com/hermis-live
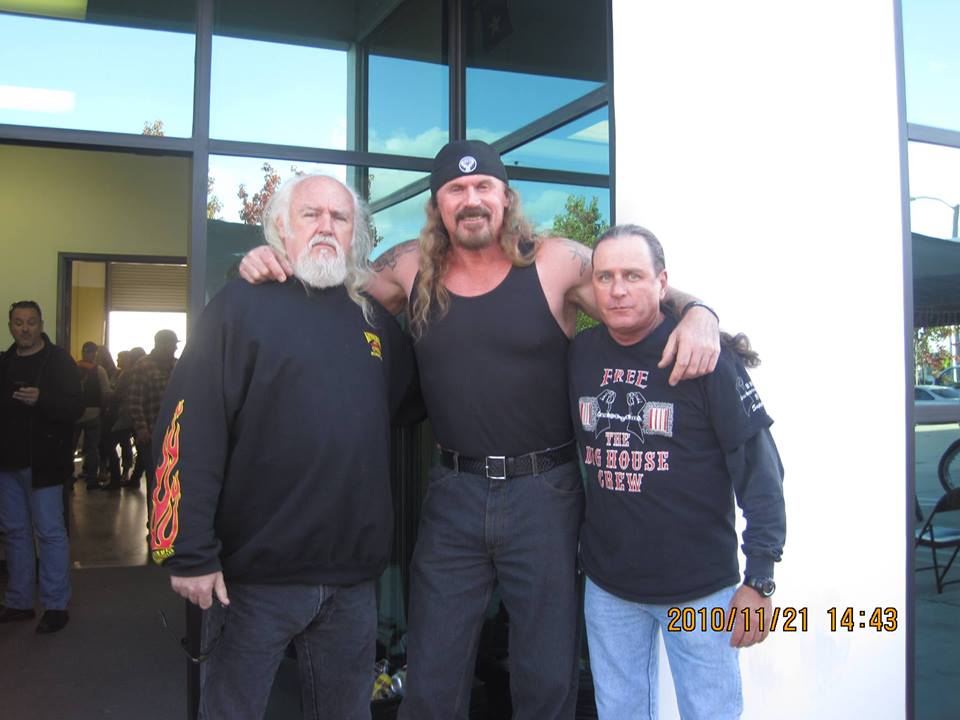
- davidlabrava.com
- emiliorivera.com/
- http://kandymankustompaint.com
- http://pipelinept.com/
- http://womenmotorcyclist.com
- http://www.ehlinelaw.com
- https://ammo.com/
- SAN DIEGO CUSTOMS
- www.biggshd.com
- www.bighousecrew.net
- www.bikersinformationguide.com
- www.boltofca.org
- www.boltusa.org
- www.espinozasleather.com
- www.illusionmotorcycles.com
- www.kennedyscollateral.com
- www.kennedyscustomcycles.com
- www.listerinsurance.com
- www.sweetwaterharley.com

Hanging out

hanging out
Good Friends

brothers
GOOD FRIENDS

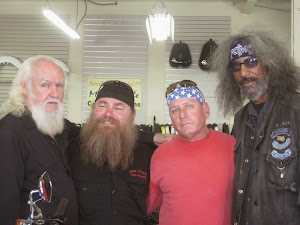
EMILIO & SCREWDRIVER

GOOD FRIENDS
Danny Trejo & Screwdriver

Good Friends
Navigation
Welcome to Bikers of America, Know Your Rights!
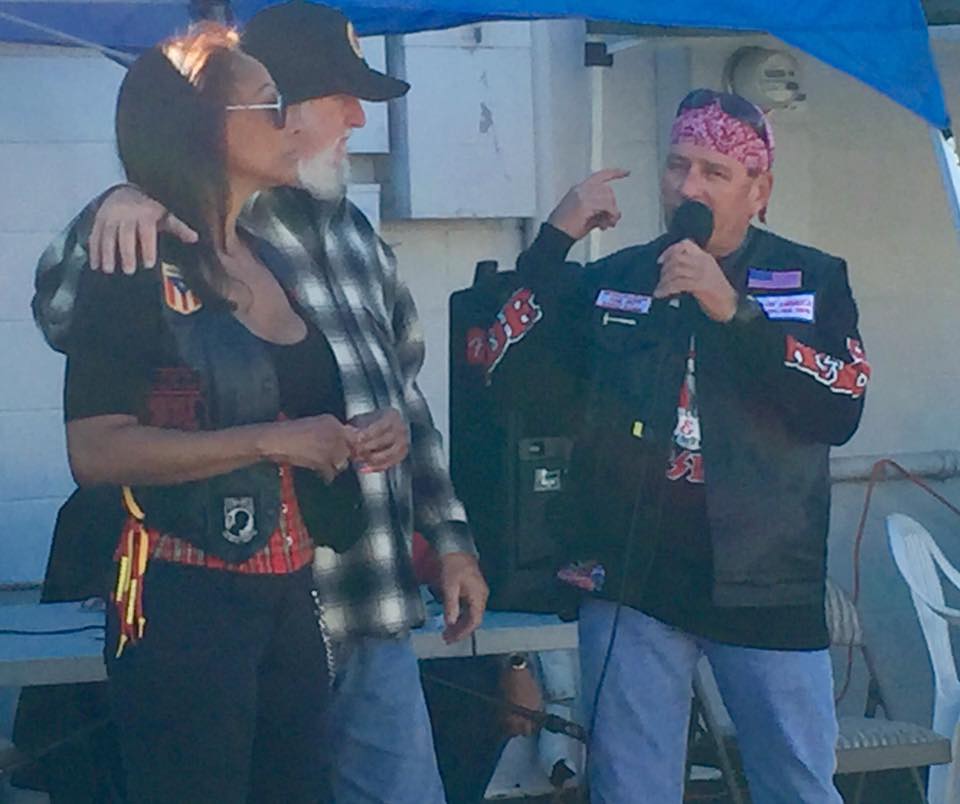
“THE BIKERS OF AMERICA, THE PHIL and BILL SHOW”,
A HARDCORE BIKER RIGHTS SHOW THAT HITS LIKE A BORED AND STROKED BIG TWIN!
ON LIVE TUESDAY'S & THURDAY'S AT 6 PM P.S.T.
9 PM E.S.T.
CATCH LIVE AND ARCHIVED SHOWS
FREE OF CHARGE AT...
BlogTalkRadio.com/BikersOfAmerica.
Two ways to listen on Tuesday & Thursday
1. Call in number - (347) 826-7753 ...
Listen live right from your phone!
2. Stream us live on your computer: http://www.blogtalkradio.com/bikersofamerica.
Good Times

Hanging Out

Key Words
- about (3)
- contact (1)
- TENNESSEE AND THUNDER ON THE MOUNTAIN (1)
- thinking (1)
- upcoming shows (2)
Blog Archive
-
▼
2010
(4242)
-
▼
May
(300)
- The Truth about SB1070 and the New Arizona Law
- Minipulated News
- OFF THE WIREHONOR RECIPIENT, EL CAJON, CA, THURSDA...
- Outlaws club member pleads in drug investigation
- Sons of Anarchy: Season Two Arrives on DVD and Blu...
- ABATE LOCAL 6 Dates and info for the coming month
- “THE BIKERS OF AMERICA,THE PHIL AND BILL SHOW”
- MEcalm
- New York Motorcycle Club Shut Down
- 1,000 bikers rally, seek reforms in Ottawa Hills
- The Feds’ Illegal/Unauthorized/Murderous War on Bi...
- Biker Lowdown Radio Show Bike Night
- Ottawa Hills officer found guilty in biker shooting
- Ohio Bike Week ready to roar
- Highwaymen racketeering trial heads to jury
- Manville officials mull stricter regulations after...
- “Bikers Against Discrimination” Executive Director...
- Why Are Barney Phife Cops Being Outfitted With Ges...
- THAN YOU TO ALL U.S. SERVICEMEN/WOMEN WHO PAID THE...
- No title
- Run for the Wall: Veteran rides to D.C. to honor t...
- From the MASS AG's office regarding auto insurance
- Two Quick & Easy Cross-Examination Tips
- Advice for everyone..
- business meeting
- ABATE of Washington
- Sin City Crew need`s our help and support
- Action Alert: SB 435 - Motorcycle Smog Bill - Sche...
- Speculation about Charleston crash
- Motorcycle rally coming to Simpsonville
- Highwaymen lawyers, prosecutors clash in closing a...
- Hell on wheels?
- We Care Ride 2010
- Thoughts from Fran
- Readin', writin' and ridin'
- OF THE WIREhttp://editorial.autos.msn.com/blogs/au...
- The Fight Like A Girl Poker Run and Games Weekend
- Harley-Davidson Museum Hosts Evel Knievel Exhibit
- Press Release ABATE of Florida
- The Legendary Buffalo Chip to Host World Famous Ra...
- illegal video
- Sand on the road
- Two Quick & Easy Cross-Examination Tips
- "New York Rider - B.A.D. Day on the Mountain"
- Bike club ready for OC return during holiday
- recording in public
- EXCITING FULL THROTTLE NATION SHOW THIS WEEK!
- Helmets Can Save Your Life *Motorcycles Articles
- **Calvin Janisch recalled as having it all
- Run for the Wall coming to town
- ATTIKA is back at the Viper Room again June 11th.
- CHP highlights motorcycle safety *
- WASHINGTON DC:Rolling Thunder 2010 Memorial Day We...
- Breaking Bad: CA vs. the Other States
- Defective Helmet
- Simpsonville to add extra patrols for motorcycle r...
- 1,000 bikers rally, seek reforms in Ottawa Hills
- Hells Angels Jammin' with 81
- Motorcycle rally coming to Simpsonville
- Motorcyclists protest Quebec insurance hikes
- SB 435 scheduled for vote
- ALERT: California Volunteers Needed
- California vs Texas....
- NHTSA Update
- more motorcycle awareness messages
- Rolling Thunder means look out for motorcycles
- Australia - Second Time he has done this
- Myrtle Beach area officials lay out Bikefest plans
- Do You Know Where Your EPA Stamp Is?
- Highwaymen lawyers, prosecutors clash in closing a...
- Hell on wheels?
- Miami-Dade police hunt for driver in hit-run with ...
- RECALL:ADVANCED CARBON COMPOSITES EXT MOTORCYCLE H...
- Phil Horne has become quite a champion
- Janet Hogan says "THANKS !"
- Terrorist attack in Missouri
- New Details in Fatal Motorcycle Crash
- New York Freedom Riders New York Legislation and n...
- Randolph native and Vietnam veteran killed outside...
- Driver guilty in death of Haverhill couple on cycle
- Ohio Bike Week ready to roar
- Like minded thinkers!
- Motorcyclists Need To Raise A Stink When Cars Hit ...
- Motorcyclists gather in Mesa to raise awareness
- New Details in Fatal Motorcycle Crash
- Maryland Citizens Face Felony Charges for Recordin...
- Motorcycle rally will benefit troops
- Why Are Barney Phife Cops Being Outfitted With Ges...
- A mother’s nightmare
- No bail for men charged in officer's death Suspect...
- Make sure officer did not die in vain
- Slain police officer was trying to save his neighb...
- Motorcycle dealers grit teeth through bumpy downturn
- Keeping motorcycle safety on track
- Pocono Mountains Buffalo Soldiers Motorcycle Club ...
- Hot Leathers: Biker Rally at the Rock 3
- Moon's Custom Cycles closes in Ignacio
- B.C. appeal court sides with Hells Angel associate...
- Local BACA Members Make Big Impact
- Sin City Crew need our help and support
-
▼
May
(300)
Bikers of America, Know Your Rights!... Brought to you by Phil and Bill
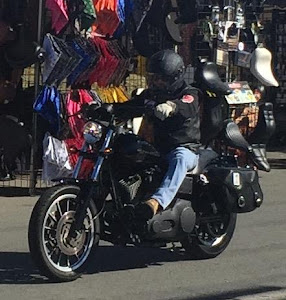
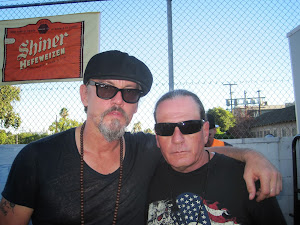
Philip, a.k.a Screwdriver, is a proud member of Bikers of Lesser Tolerance, and the Left Coast Rep
of B.A.D (Bikers Against Discrimination) along with Bill is a biker rights activist and also a B.A.D Rep, as well, owner of Kennedy's Custom Cycles